“The best way to measure your investing success is not by whether you are beating the market, but by whether you’ve put in place a financial plan and a behavioral discipline that are likely to get you where you want to go!” – Benjamin Graham
The markets rebounded strongly in the second quarter, bouncing back from a weak first quarter (S&P 500® Index -5% in Q1, compared to +15% in Q2), which reflects the effect of the commencement of war between the United States/Israel and Iran and its proxies in late February. Our clients, and most investors, enjoyed substantial appreciation across a range of strategies in the quarter.
However, the markets continue to be shaped by ongoing geopolitical conflict, higher energy prices caused by blockades in the Strait of Hormuz, tariffs, the AI buildout, higher inflation, shifting interest rates, a new Federal Reserve Chair, private credit fund liquidity, and divisive politics as we approach a pivotal midterm election in November.
It also seems that a small number of large companies continue to drive market outcomes. Yet the specific companies propelling the equity markets keep changing, which has somewhat broadened market performance. Equity benchmarks now almost remind me of political gerrymandering with the way they are reconstituted as that tends to distort returns. Whether it’s the Magnificent 7 plus one or semiconductor companies, including memory chip makers, getting added or dropped from indices, the benchmarks have become elusive for many investors, both professional and individual. In some cases, it makes little sense to us why certain companies are included in indices where they do not seem to belong. For example, Alphabet and Meta Platforms were both in the Russell 1000 Value Index, as were Micron Technology (+242% for the quarter) and Sandisk (+258% for the quarter), despite all four posting explosive earnings growth (all but Meta Platforms were removed on June 29, 2026 and added to the Russell 1000 Growth Index). This is just our opinion, as benchmarks morph with companies cascading in and out.
The chart on the next page shows the 2026 performance of the more recent darlings of the past few years. Their performance has had a significant influence on the returns for the S&P 500® Index as well as the Russell 1000 Growth and Value Indices.
| Exhibit 1: Semiconductors vs the Magnificent 7 Key Takeaway: Owning “technology” alone was not enough to capture the market’s strongest returns so far this year. Investors who were positioned in the semiconductor ecosystem benefited substantially more than those concentrated in the Magnificent 7. This underscores the importance of diversification within technology investments and identifying the areas with the strongest earnings and demand trends. |
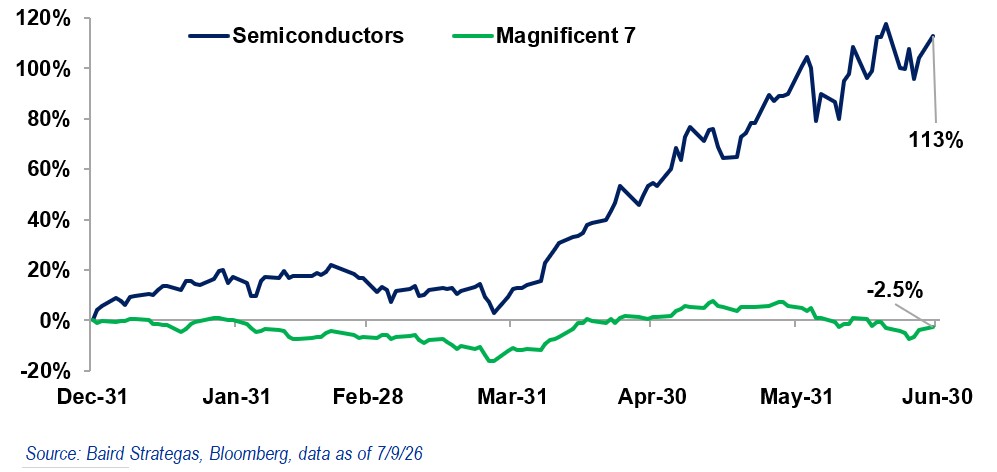
The point of this chart is to demonstrate how the Magnificent 7 (just seven out of 500 companies) which drove much of the market returns for 2024 and 2025, have thus far in 2026 not been a major factor. Instead, semiconductor companies have dramatically led the way this year, even though they were considered cyclical in years past. Micron Technology, which was unprofitable just three years ago, is up a staggering 304% this year (up 242% in Q2), while Sandisk is up 858% (up 258% in Q2), Intel 278% (up 216% in Q2) which required an infusion from our government, Marvell Technology 251% (up 201% in Q2), and Advanced Micro Devices 171% (up 186% in Q2). While there is earnings growth and pricing power to support these gains, we remain concerned about what might happen when the AI buildout eventually slows. We assume that slowdown will come at some point, but it is impossible to say when. Watch out if one dabbles in levered ETFs that invest in these market darlings. These levered investments could lead to large losses (note that FLI does not invest in such aggressive strategies).
Our opening quote is meant to highlight the importance of having a plan to grow wealth on an absolute basis, rather than trying to outpace market benchmarks that frequently change in their components and are often driven by a small number of companies. Shifts in economic conditions or demand can make these benchmarks especially volatile. While volatility and momentum can be rewarding on the upside, they can also be deeply painful on the downside.
BACK TO EARTH
We remain positive in all strategies, but it is important to stay focused on what is really happening in our economy and the world. We have always relied on earnings and interest rates as our guiding beacons, and, in our view, that remains important for the long term. As shown in the chart below, earnings appear to be robust, and we agree with that assessment.
| Exhibit 2: 2025 vs. 2026 vs. 2027 S&P 500® Index Earnings Per Share Progression Key Takeaway: Consensus estimates forecast meaningful future earnings growth. If realized, this strong earnings trajectory would provide a solid fundamental foundation for continued gains in equities and reinforces the importance of staying focused on long-term corporate profitability rather than short-term market fluctuations. |
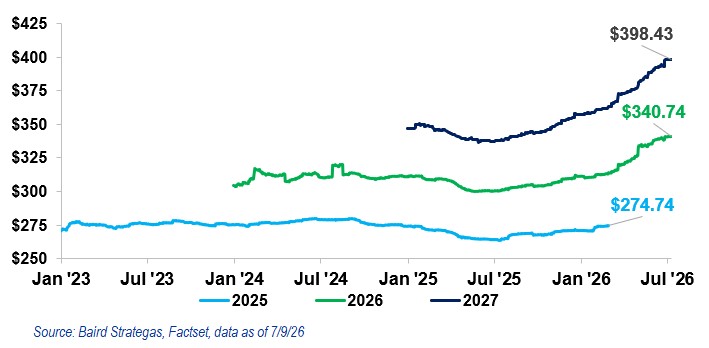
The good news is not just the upward trajectory of earnings, including projections for 2027. The upward revisions in most sectors, beyond Information Technology, for both revenue and earnings are also promising (according to Baird Strategas, our economics consultant).
| Exhibit 3: Estimated S&P 500® Index Operating Margin Key Takeaway: Consensus expectations for the S&P 500® Index operating margins 12 months out is at a record 20.8%, reflecting optimism in corporate America’s ability to improve productivity, leverage AI-driven efficiencies, and continue delivering strong earnings growth despite a challenging economic environment. |
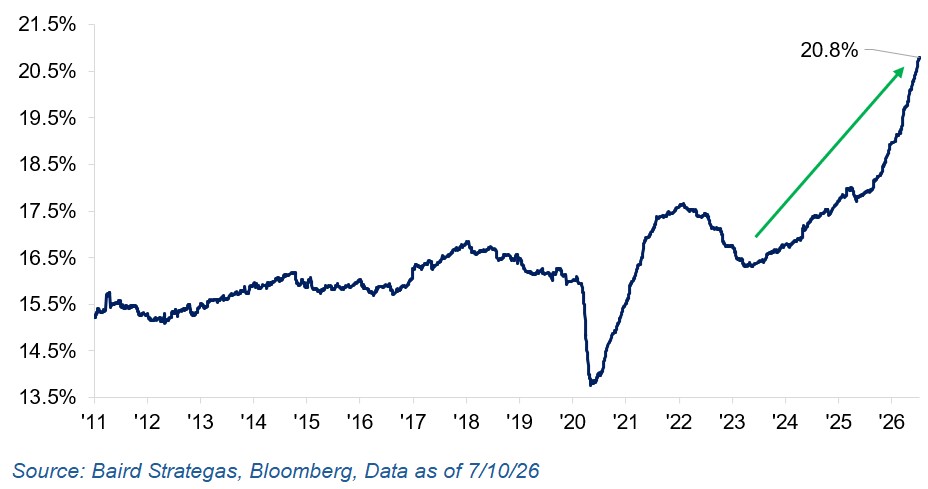
This chart demonstrates improved operating margins, which, in our opinion, can be attributed to the growing influence of technology companies, increased AI-driven productivity, and stronger management practices across the board.
In our opinion, strong margins reflect increased profitability and financial strength. Adding to this positive outlook, our banking system appears to be in excellent shape, with leading banks all passing their stress tests, results of which were posted shortly before the end of the quarter. The payout ratio for the S&P 500® Index stands at a very low 29.3%, which is encouraging and speaks to financial strength given the amount of earnings companies are retaining.
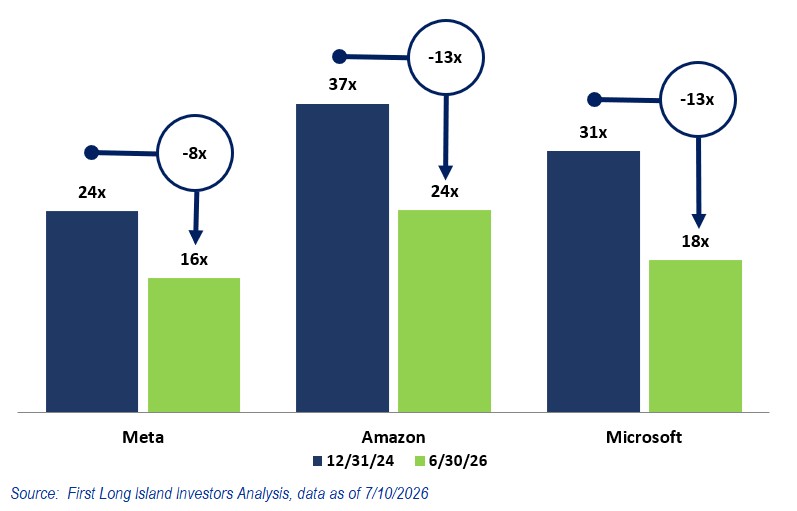
A cautionary note is warranted. Most hyperscalers, the big Information Technology and Communication Services companies, have shifted from being major free cash flow generators to significant spenders as they invest heavily in the AI buildout. They moved from being “asset light” to more “asset heavy.” This shift should be a concern for investors as we await the outcome of these investments. While these companies are typically well managed, we, like many investors, remain somewhat cautious. This change has already affected valuations, as seen with Microsoft, which is down 23% this year despite earnings gains, partly because of its use of free cash flow to fund AI capital expenditures as well as the software disintermediation cloud hanging over it. The following chart shows that these leading hyperscalers are now trading at a lower forward price-to-earnings ratio as compared to January 2025.
| Exhibit 4: The Market Is Penalizing the Valuations of the Buyers of AI Infrastructure Key Takeaway: The valuations for companies making the largest AI investments have compressed, reflecting caution about near-term returns rather than long-term potential. If these investments generate stronger earnings and cash flow, today’s lower valuations could present an attractive opportunity for long-term investors. |
As for the all-important interest rates, we do not expect an increase in July from the Federal Reserve under new Federal Reserve Chairman Kevin Warsh. We believe that investors can operate within the current range of the 10-year U.S. Treasury yield of about 4.25% to 4.75%. Despite higher than desired inflation, mainly driven by the spike in energy costs, we do not anticipate a rate increase, especially given the ongoing conflict with Iran. Efforts to build alternate supply routes, new infrastructure to bypass Iran’s hold on the Strait of Hormuz (certain countries are building new pipelines that may become operational as early as Q2 2027), are also an important factor in the future of energy costs, which we expect will become less panic driven and less of a source of inflation.
Affordability is not just a buzzword being used by progressive politicians. It is a real concern for many Americans as evidenced by the chart below.
| Exhibit 5: Baird Strategas’ Common Man Consumer Price Index vs. Hourly Earnings (Indexed = 100, June 2020) Key Takeaway: Although inflation has cooled from its peak, the cumulative rise in prices has exceeded wage growth, leaving many households facing higher living costs and reduced purchasing power. |
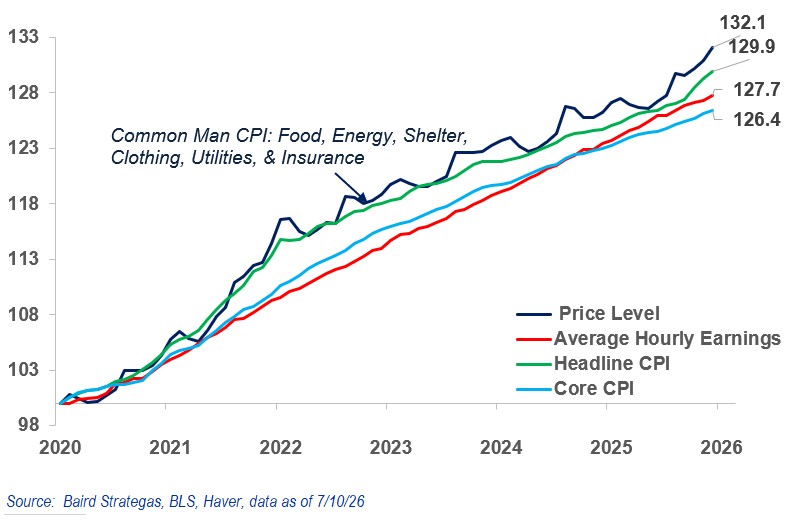
Bottom line, the inflation that began under the Biden administration and has remained elevated during the current administration, primarily due to energy costs, remains a challenge that needs to be addressed. We are certain this will be a major campaign issue in November.
HOW TO INVEST GOING FORWARD
Looking at valuation based on projected earnings growth for this year and next, we do not believe we are in bubble territory for the average company. The technology bubble of 2000 saw the average forward price-to-earnings ratio for the 50 largest companies at 45 while the 10-year U.S. Treasury yield averaged about 6%. Today, conditions are more benign, where the average forward price-to-earnings ratio for the largest 50 companies is around 33, and the 10-year U.S. Treasury yield is about 4.5%. The price-to-earnings ratio for the S&P 500® Equal Weighted Index on estimated 2027 earnings is a fairly reasonable 16x. To us, this suggests that being broadly diversified and investing for the long term remains a prudent approach at this stage. We continue to emphasize the importance of broad diversification, with exposure to both growth and value stocks, while some allocation to fixed income and real estate makes sense for most clients.
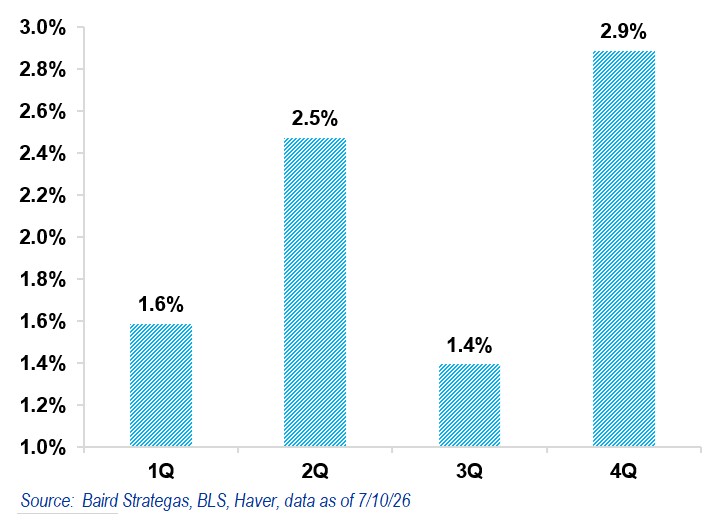
History appears to be on the side of investors, but it is a guide and not a guarantee. The following chart shows the quarterly performance of the S&P 500® Index going back to 1928.
| Exhibit 6: S&P 500® Index Quarterly Performance since 1928 Key Takeaway: Since 1928, the S&P 500® Index has consistently rewarded long-term investors. While quarterly declines are inevitable, history shows that maintaining a disciplined, long-term investment approach has been one of the most effective ways to build wealth. |
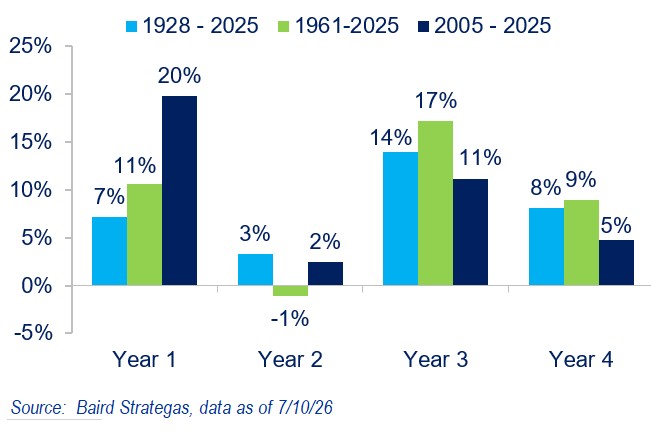
Finally, from a historical perspective, the third year of a presidential term is typically the strongest from an equity return standpoint. However, this is only a historical guide!
| Exhibit 7: S&P 500® Index Average Annual Price Returns By Presidential Cycle Key Takeaway: History shows the third year of a presidential term has typically been the strongest year for equity returns, although past performance is no guarantee of future results. |
FINAL WORDS
We saw a strong rebound from a crisis-oriented first quarter. Earnings and interest rates appear supportive of better equity results for the remainder of this year and into next. Recent tax legislation, along with the turnaround in tariffs, is fostering a more favorable environment for both businesses and consumers. History also seems to favor the long-term investor for the balance of this year and next. That said, risks remain including regional geopolitical conflict (mainly Iran), sticky inflation, political divisiveness, and unusual individual stock volatility that can impact even the strongest companies.
As the legendary investor Ben Graham once advised, it pays to plan. Work with us at FLI to develop a customized wealth management and investment strategy that gives you the opportunity to grow your wealth through proper diversification among companies, real estate, alternatives, and fixed income, focusing on investments that grow earnings and cash flow with a view towards long-term prosperity. In our opinion, nothing else, including market benchmarks, really matters. Our goal is to help you grow your wealth over time without taking on excessive risk, while hopefully allowing you to sleep well at night.
Have a great summer, and remember that you can reach out to anyone on our investment and wealth management teams at any time for guidance on any wealth or investment matters.
Best regards,
Robert D. Rosenthal
Chairman, Chief Executive Officer and Chief Investment Officer
DISCLAIMER
The views expressed herein are those of Robert D. Rosenthal or First Long Island Investors, LLC (“FLI”), are for informational purposes, and are based on facts, assumptions, and understandings as of July 27, 2026 (the “Publication Date”). This information is subject to change at any time based on market and other conditions. This communication is not an offer to sell any securities or a solicitation of an offer to purchase or sell any security and should not be construed as such. References to specific securities and issuers are for illustrative purposes only and are not intended to be, and should not be interpreted as, recommendations to purchase or sell such securities. Nothing herein should be construed as a recommendation to purchase any particular security. The companies and securities described herein may not be held in every (or any) FLI strategy at any given time. Investment returns will fluctuate over time, and past performance is not a guarantee of future results.
This communication may not be reproduced, distributed, or transmitted, in whole or in part, by any means, without written permission from FLI.
All performance data presented throughout this communication is net of fees, expenses, and incentive allocations through or as of June 30, 2026, as the case may be, unless otherwise noted. Past performance of FLI and its affiliates, including any strategies or funds mentioned herein, is not indicative of future results. Any forecasts included in this communication are based on the reasonable beliefs of Mr. Rosenthal or FLI as of the Publication Date and are not a guarantee of future performance. This communication may contain forward-looking statements, including observations about markets and industry and regulatory trends. Forward-looking statements may be identified by, among other things, the use of words such as “expects,” “anticipates,” “believes,” or “estimates,” or the negatives of these terms, and similar expressions. Forward-looking statements reflect the views of the author as of the Publication Date with respect to possible future events. Actual results may differ materially.
FLI believes the information contained herein to be reliable as of the Publication Date but does not warrant its accuracy or completeness. This communication is subject to modification, change, or supplement without prior notice to you. Some of the data presented in and relied upon in this document are based upon data and information provided by unaffiliated third-parties and is subject to change without notice.
NO ASSURANCE CAN BE MADE THAT PROFITS WILL BE ACHIEVED OR THAT SUBSTANTIAL LOSSES WILL NOT BE INCURRED.
Copyright © 2026 by First Long Island Investors, LLC. All rights reserved.