“In the short run, the market is a voting machine but in the long run, it is a weighing machine.” Benjamin Graham
The third quarter ended with gains for the major indices and nearly all FLI strategies. During the quarter, investors faced moderately higher inflation, the Federal Reserve’s first rate increase in years, and continued conflict in the Middle East as well as between Russia and Ukraine.
Many Americans struggled with affordability, largely because of the rise in the cost of oil and therefore gasoline. Much of the rise in oil prices can be attributed to Iran’s apparently unlawful (in our opinion) closure of the Strait of Hormuz, sabotage of a Saudi Arabian pipeline, and other disruptions allegedly caused by the Houthis, an Iranian-backed group. As of the end of the third quarter, more oil appears to be clearing the Strait of Hormuz due in part to protection provided by the U.S. military.
Alongside these economic and geopolitical concerns, investors faced several market-specific issues. Equity market performance has been driven largely by a small group of rapidly growing companies connected, either directly or indirectly, to the construction of data centers supporting artificial intelligence (AI).
Demand for AI infrastructure has driven strong growth for companies that produce processing and memory chips. A small group of companies have gained well over 100% in less than a year. This trend resembles the market leadership, but only to a lesser extent, of the “Magnificent Seven” in recent years, though that group’s influence has been less pronounced this year and during the third quarter. So, there is momentum and volatility relating to AI-oriented companies, which provided plenty of momentum to the market’s “voting machine” in recent months (See Exhibit 1). Unless you were disproportionately invested in this narrow group of companies, as seen in Exhibit 1, some of which have historically been cyclical and inherently more volatile, you did not perform as well as the market averages.
| Exhibit 1: Percent of S&P 500® Index Constituents Below All-Time High by Drawdown Threshold Key Takeaway: Market weakness extends well beyond the headline level of the S&P 500® Index. A substantial percentage of individual stocks remain well below their all-time highs, suggesting that the index’s performance may mask considerable dispersion and weakness among its constituents. Source: Baird Strategas, data as of 9/30/26 |
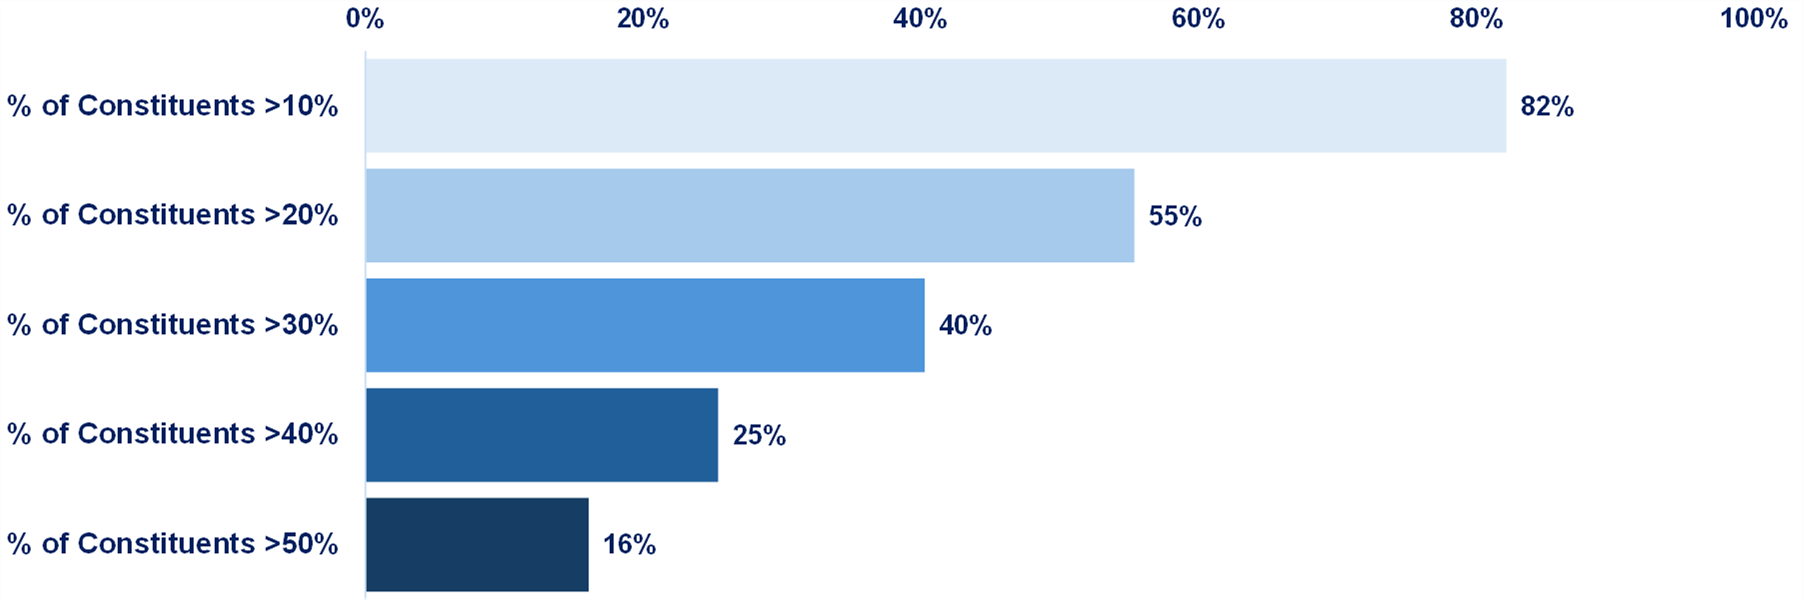
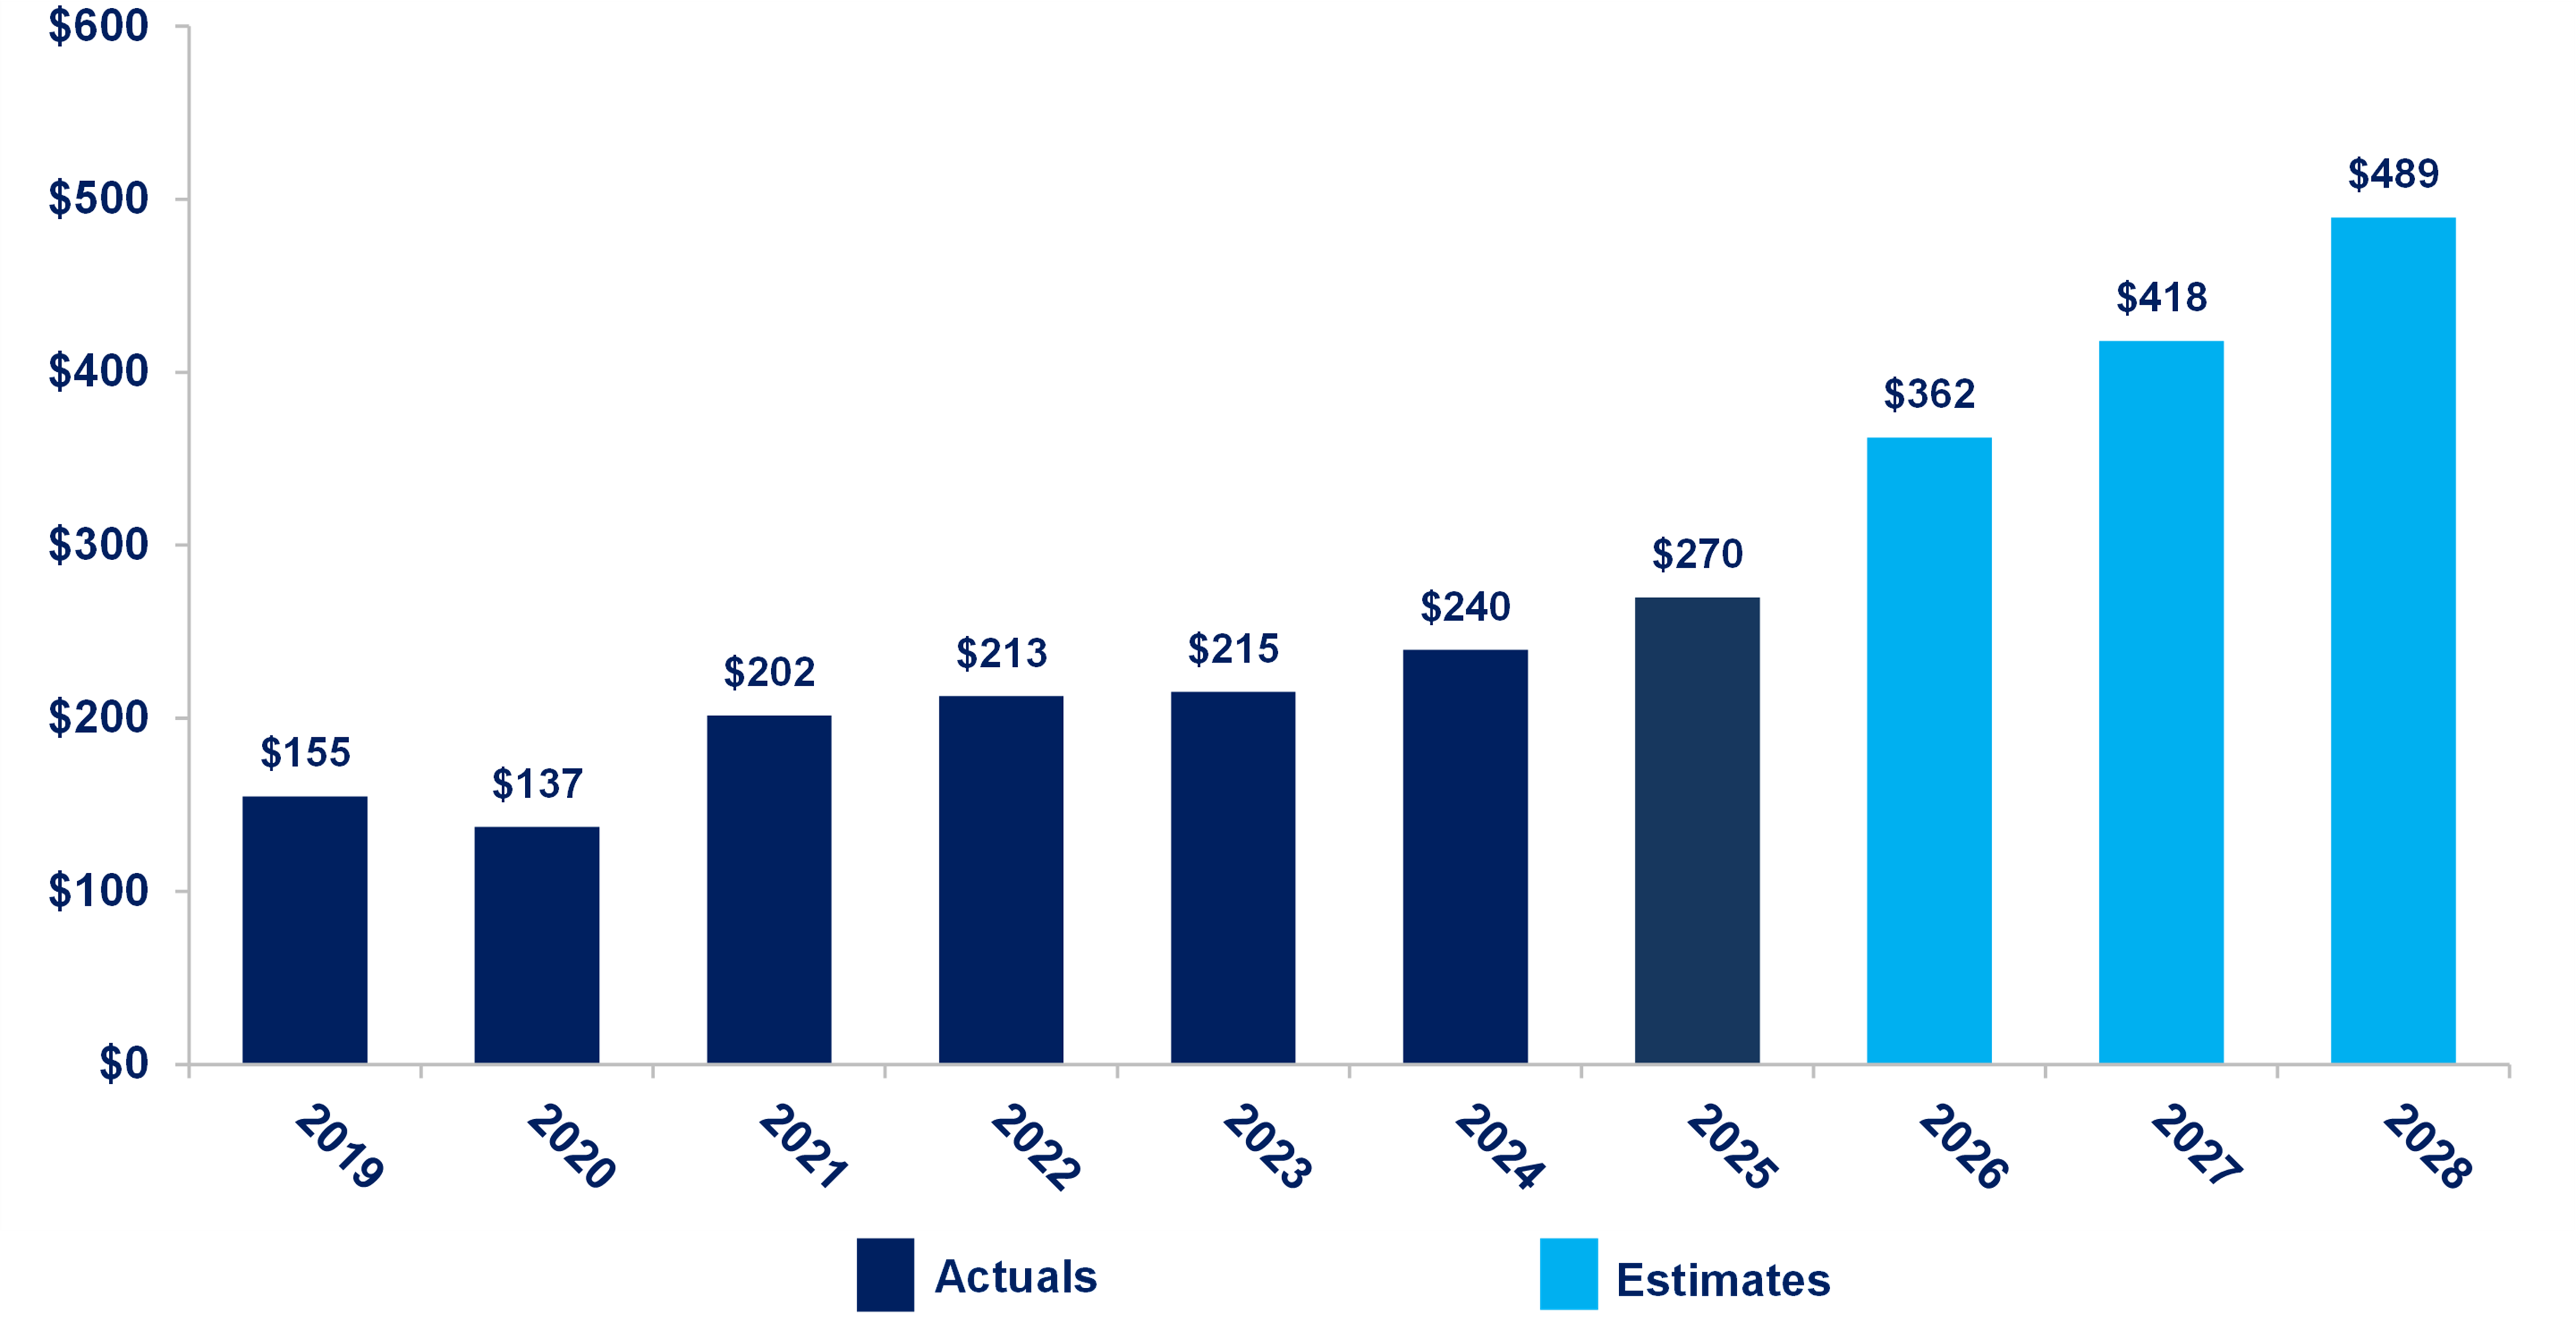
As Exhibit 1 shows, the majority of companies (55%) are trading more than 20% below their all-time highs. This suggests that most companies are already in a bear market, despite growing earnings for the index as indicated in Exhibit 2.
| Exhibit 2: S&P 500® Index Earnings Key Takeaway: S&P 500® Index earnings are expected to grow substantially through 2028, providing a potential fundamental tailwind for equities. However, these projections are estimates, not guaranteed outcomes. Source: First Long Island Investors analysis, FactSet; data as of 10/13/26 . |
Most of the best-performing technology-oriented, AI companies experienced huge revenue and earnings gains, fueled by strong demand and product shortages. The key question, of course, is how long can demand hold up.
At the same time, some investors and government officials fear that AI could put certain highly profitable software companies out of business, destroy jobs, or even pose a threat to humanity’s existence. These software companies have suffered severe price declines since the beginning of the year, with some shares declining by more than 25%. As Exhibit 1 shows, 40% of the companies in the index are more than 30% below their all-time highs.
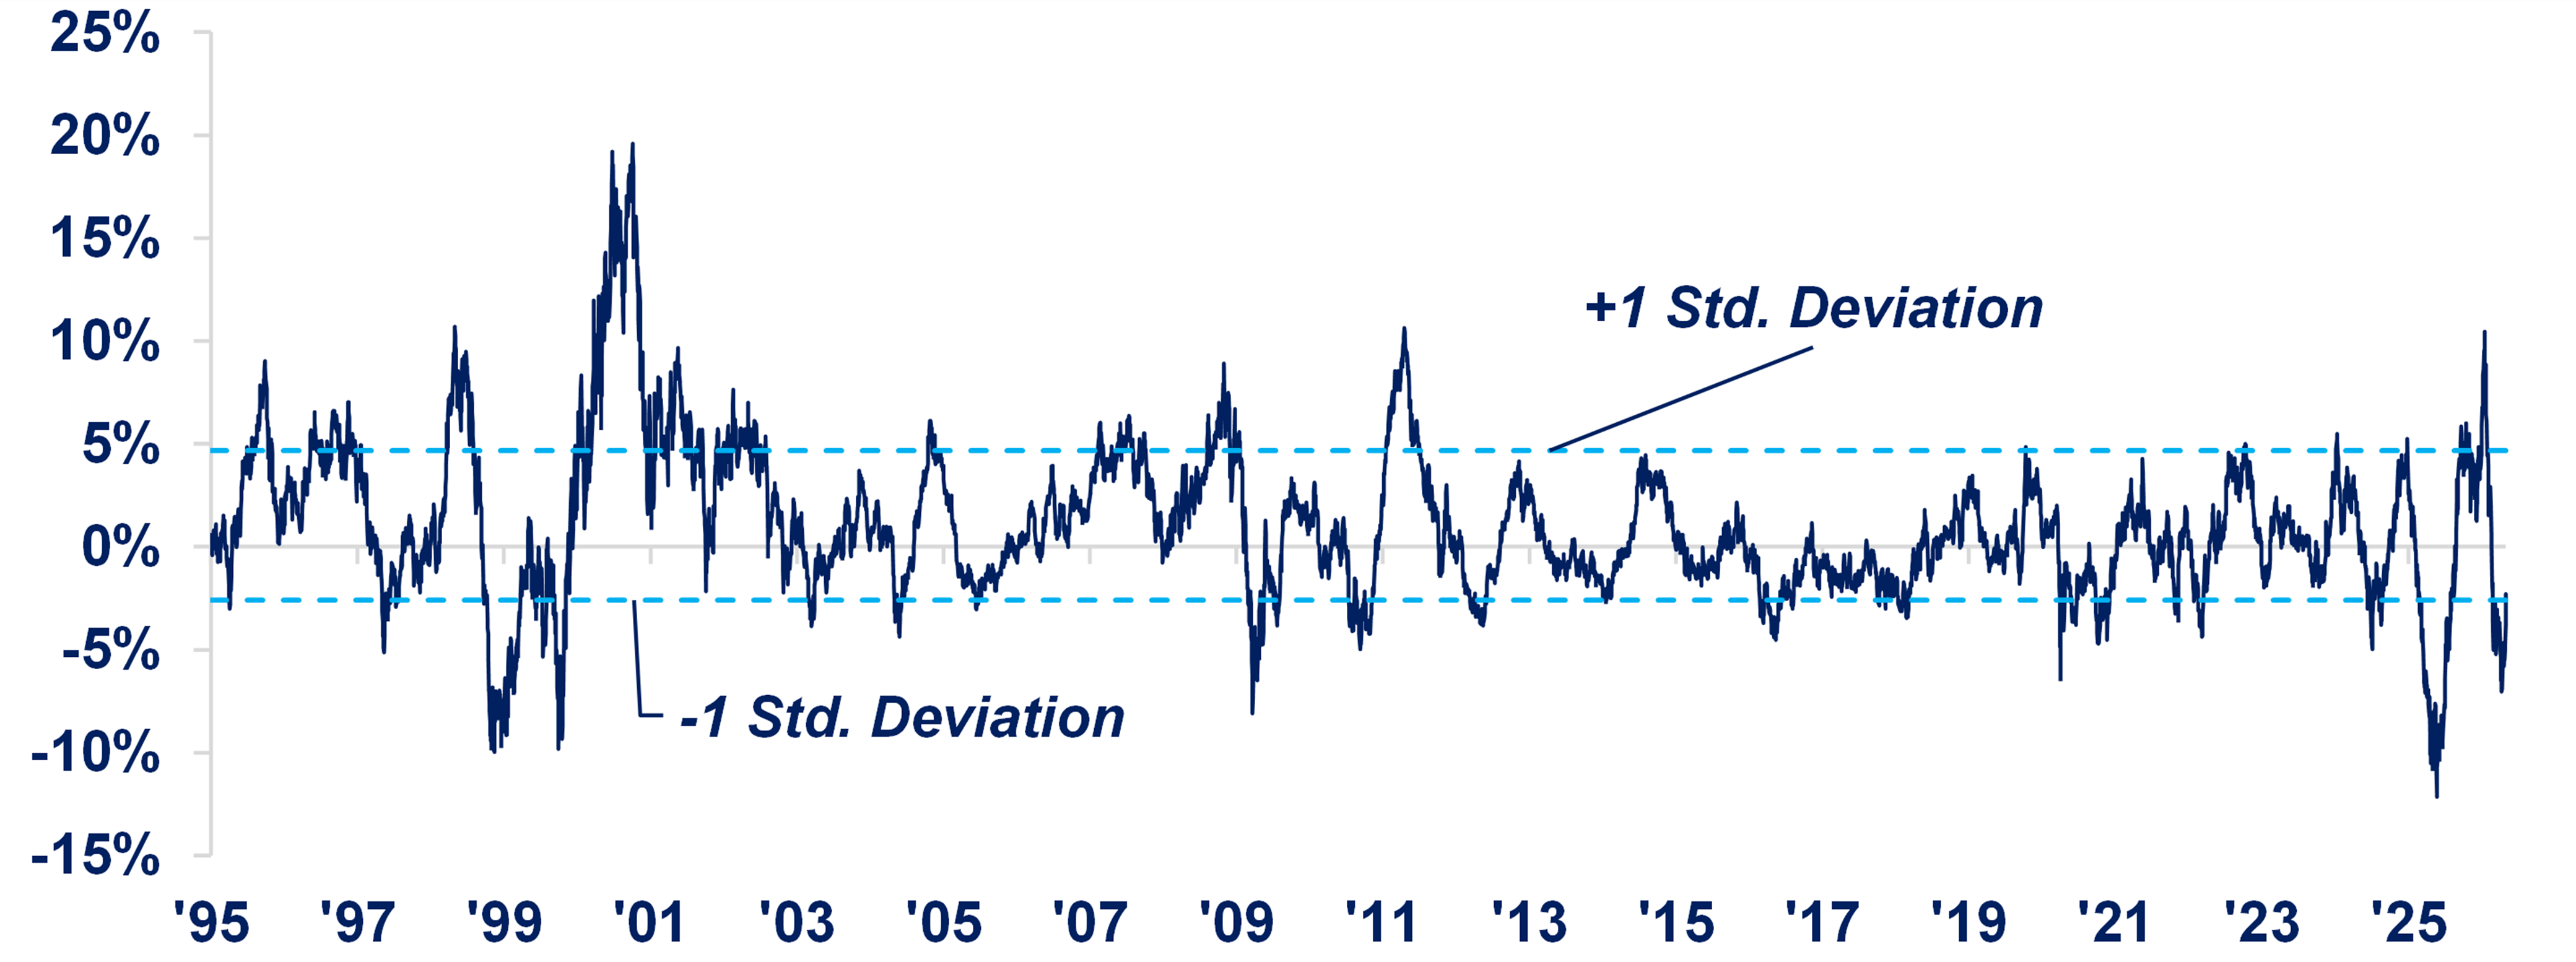
This supports our contention that the index is disproportionately influenced by a small group of technology-oriented companies. Despite earnings growth, many companies’ share prices have not kept pace. In fact, higher-quality companies appear to be underperforming as seen in Exhibit 3. We do not expect this trend to last, especially in small- and mid- caps.
| Exhibit 3: Rolling 6-Month Performance Spread: S&P 500® Quality Index Minus S&P 500® Index Key Takeaway: The six-month performance spread between the S&P 500® Quality Index and the S&P 500®Index has fluctuated significantly over time, with periods of substantial quality outperformance and underperformance. Historically, these deviations have tended to move back toward the average, suggesting that the recent divergence may present an opportunity for performance normalization. Source: Baird Strategas, Bloomberg, data as of 10/8/26 |
Also weighing on investors this past quarter, no pun intended, is the upcoming midterm election, with control of both the House of Representatives and Senate potentially at stake, along with numerous gubernatorial races. The outcome could have significant implications for current government policies concerning the war in Iran (although both parties oppose Iran acquiring a nuclear weapon), as well as immigration, taxation, and even socialism.
These issues are also contributing to market volatility and investor uncertainty. Adding to those concerns is the possibility of a greater kinetic conflict in the Middle East, either shortly before the midterms or immediately thereafter, as often threatened by President Trump.
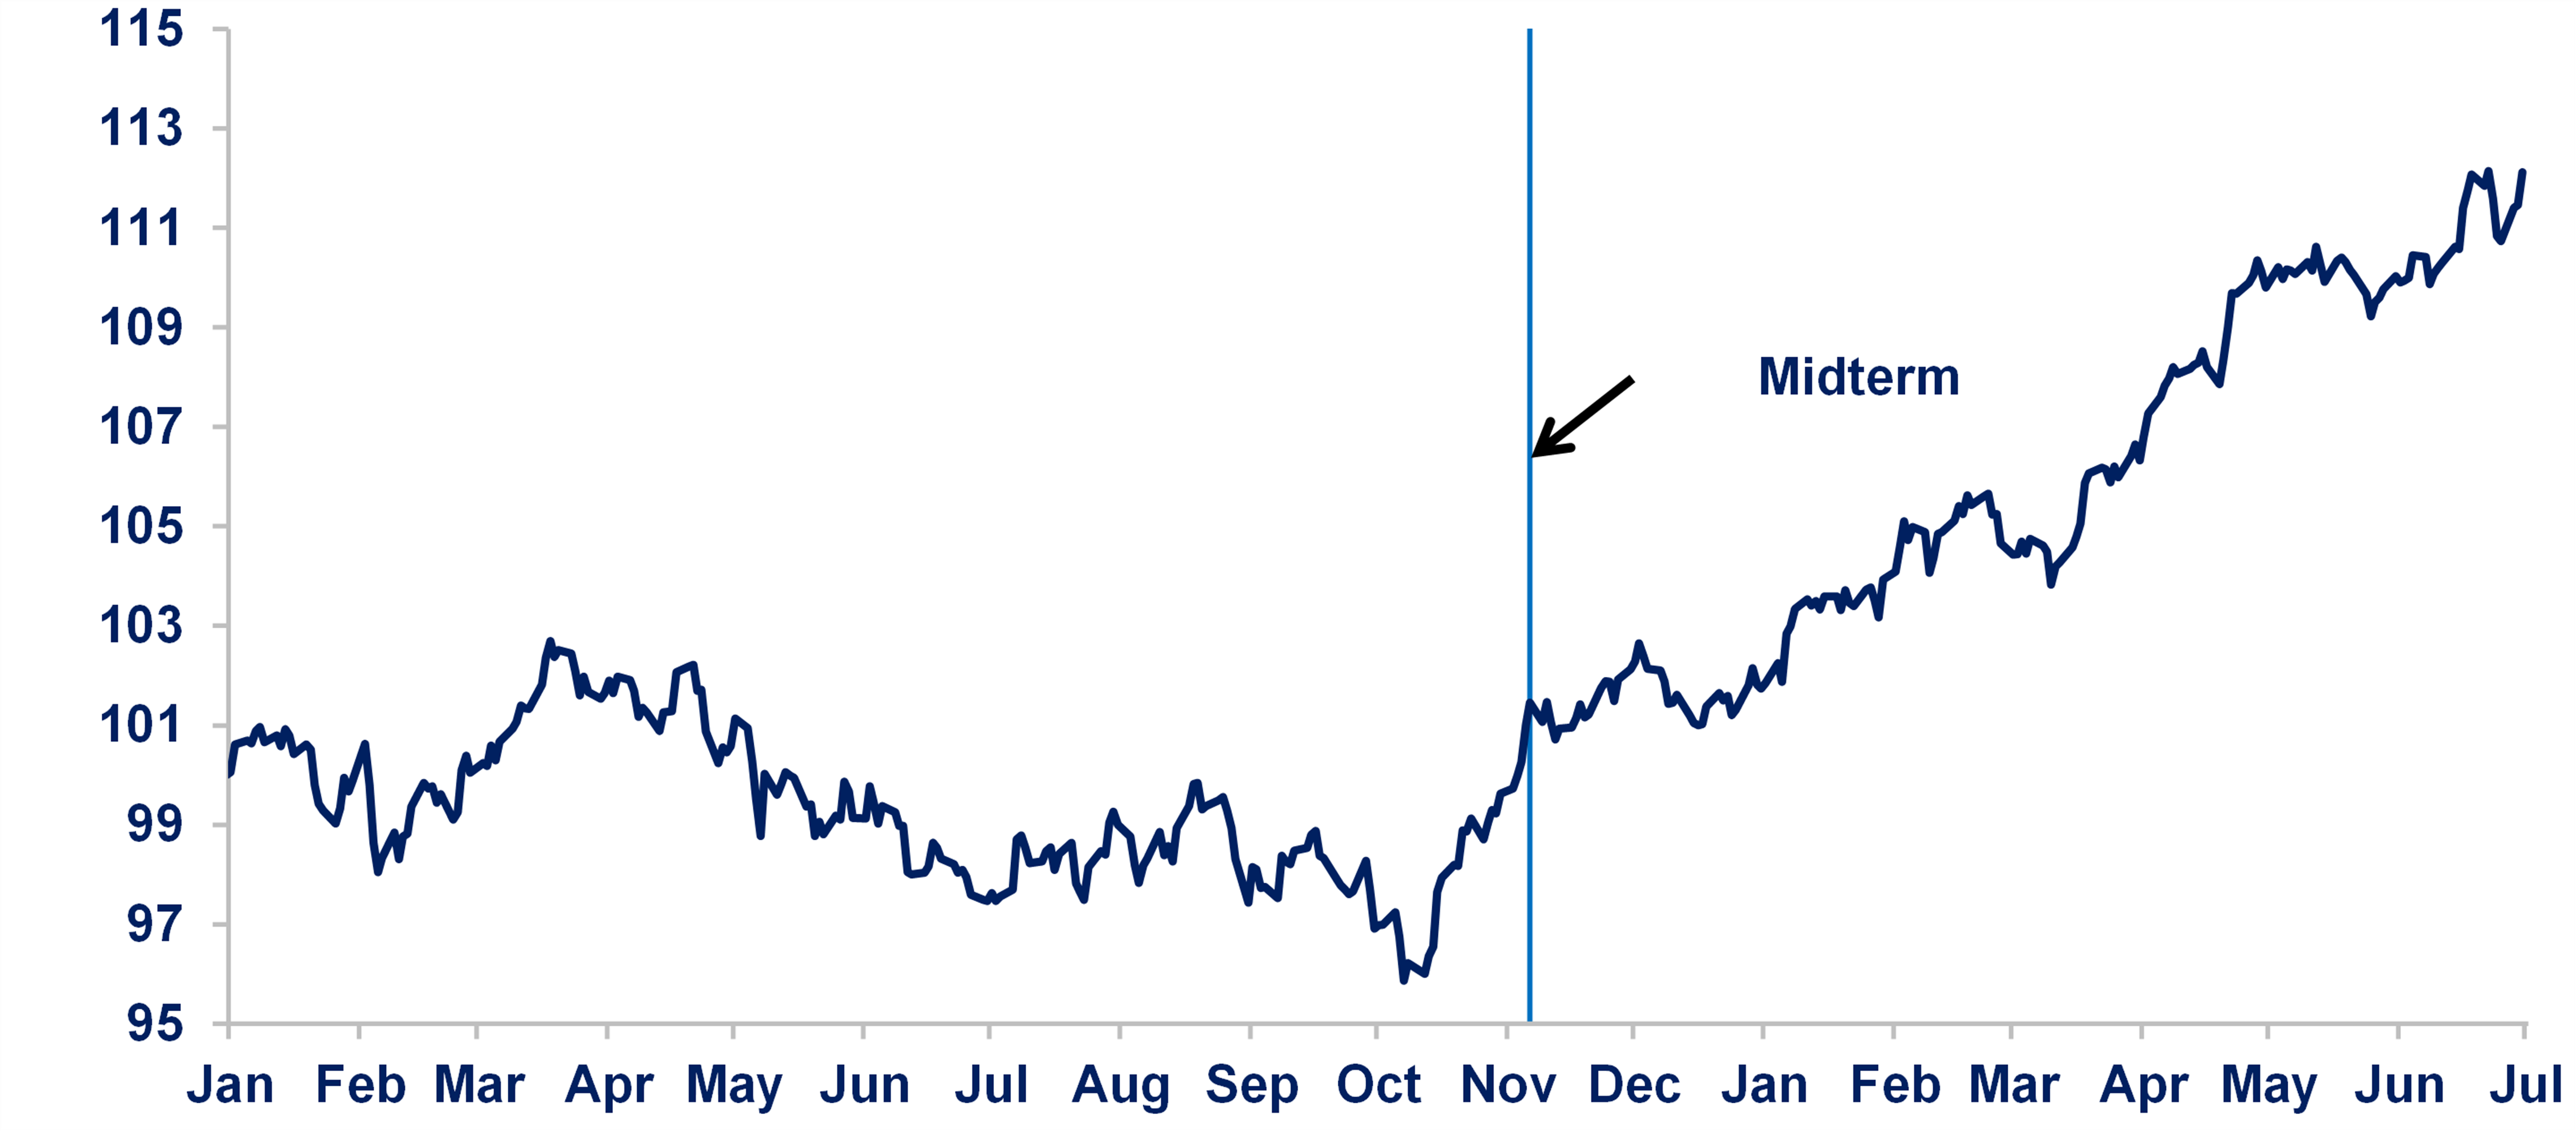
Historically, though history is only a guide, not a guarantee, equity markets have tended to increase after midterm elections, irrespective of which party retains or gains control.
| Exhibit 4: Average S&P 500® Index Performance Before & Following Midterm Elections (1994, 1998, 2002, 2006, 2010, 2014, 2018, 2022) Key Takeaway: The S&P 500® Index historically experiences sideways volatility before a midterm election, followed by a strong, consistent upward rally after the election. Source: Baird Strategas, Bloomberg, data as of 10/8/26. |
Of course, markets still face a pretty steep “wall of worry,” as outlined earlier. This is especially true given higher interest rates following a period of elevated inflation, which remains above the Federal Reserve’s long-term target of 2%. We continue to believe that modest employment growth, coupled with some resolution of the conflict with Iran, will ease inflationary pressures and eventually allow the Federal Reserve to hold or even reduce interest rates in the future.
What should investors do? Vote now and act on emotion and headlines, or should they “Weigh the Future” based on fundamentals, AI-related growth (noting that we do not believe AI will eliminate the human race), and the relatively reasonable valuations of many, though certainly not all, companies?
Our cautious optimism is supported by both the trajectory of earnings (Exhibit 2) and the relatively reasonable price-to-earnings ratios (Exhibit 5) for the S&P 500® Index, which serves as a proxy for large-cap investing:
| Exhibit 5: Price-to-Earnings Ratios (NTM) Key Takeaway: The widening valuation gap between the market-cap weighted S&P 500® Index and the S&P 500® Equal Weighted Index, showing that the overall market’s valuation is being heavily driven by its largest mega-cap stocks. Source: First Long Island Investors analysis, FactSet; data as of 10/13/26 . |
Both Exhibit 2 and Exhibit 5 suggest that the significant projected upward bias in earnings this year and next should help offset the headwinds mentioned earlier. In addition, based on projected earnings, the price-to-earnings multiples for both years offer some opportunity in the current interest rate environment, in our opinion.
We are also encouraged that the Strait of Hormuz does not appear to be as restricted as the Iranian government would like or the media reports may suggest. Shipments seem to have nearly returned to prewar levels, while the embargo on Iranian oil sales is hurting Iran’s economy, which faces recession, severe inflation, and a collapsing currency.
Over the longer term, some countries surrounding Iran are expanding pipeline capacity. Within a few years, these projects could diminish the region’s dependence on oil transported through the Strait of Hormuz, and, in turn, lessen the influence of whichever government controls Iran.
We also believe the market is broadening, with shares of companies beyond the Information Technology sector gaining price traction. Many value companies, which make up a significant portion of FLI’s Dividend Growth strategy, are performing well. For this reason, we continue to encourage clients to maintain a balanced asset allocation between growth-oriented companies, including those benefiting from the AI build out, and established companies with a history of increasing their cash dividends year after year. Both growth and value should benefit from reduced oil prices if the conflict in the Middle East moves toward a resolution in the near future. Lower oil prices will also benefit bonds, which have been hurt by elevated inflation and the subsequent increase in interest rates. Absolute yields on bonds issued by high-quality companies and municipalities, as well as the U.S. Treasury, are relatively attractive and worthy of inclusion as part of one’s asset allocation.
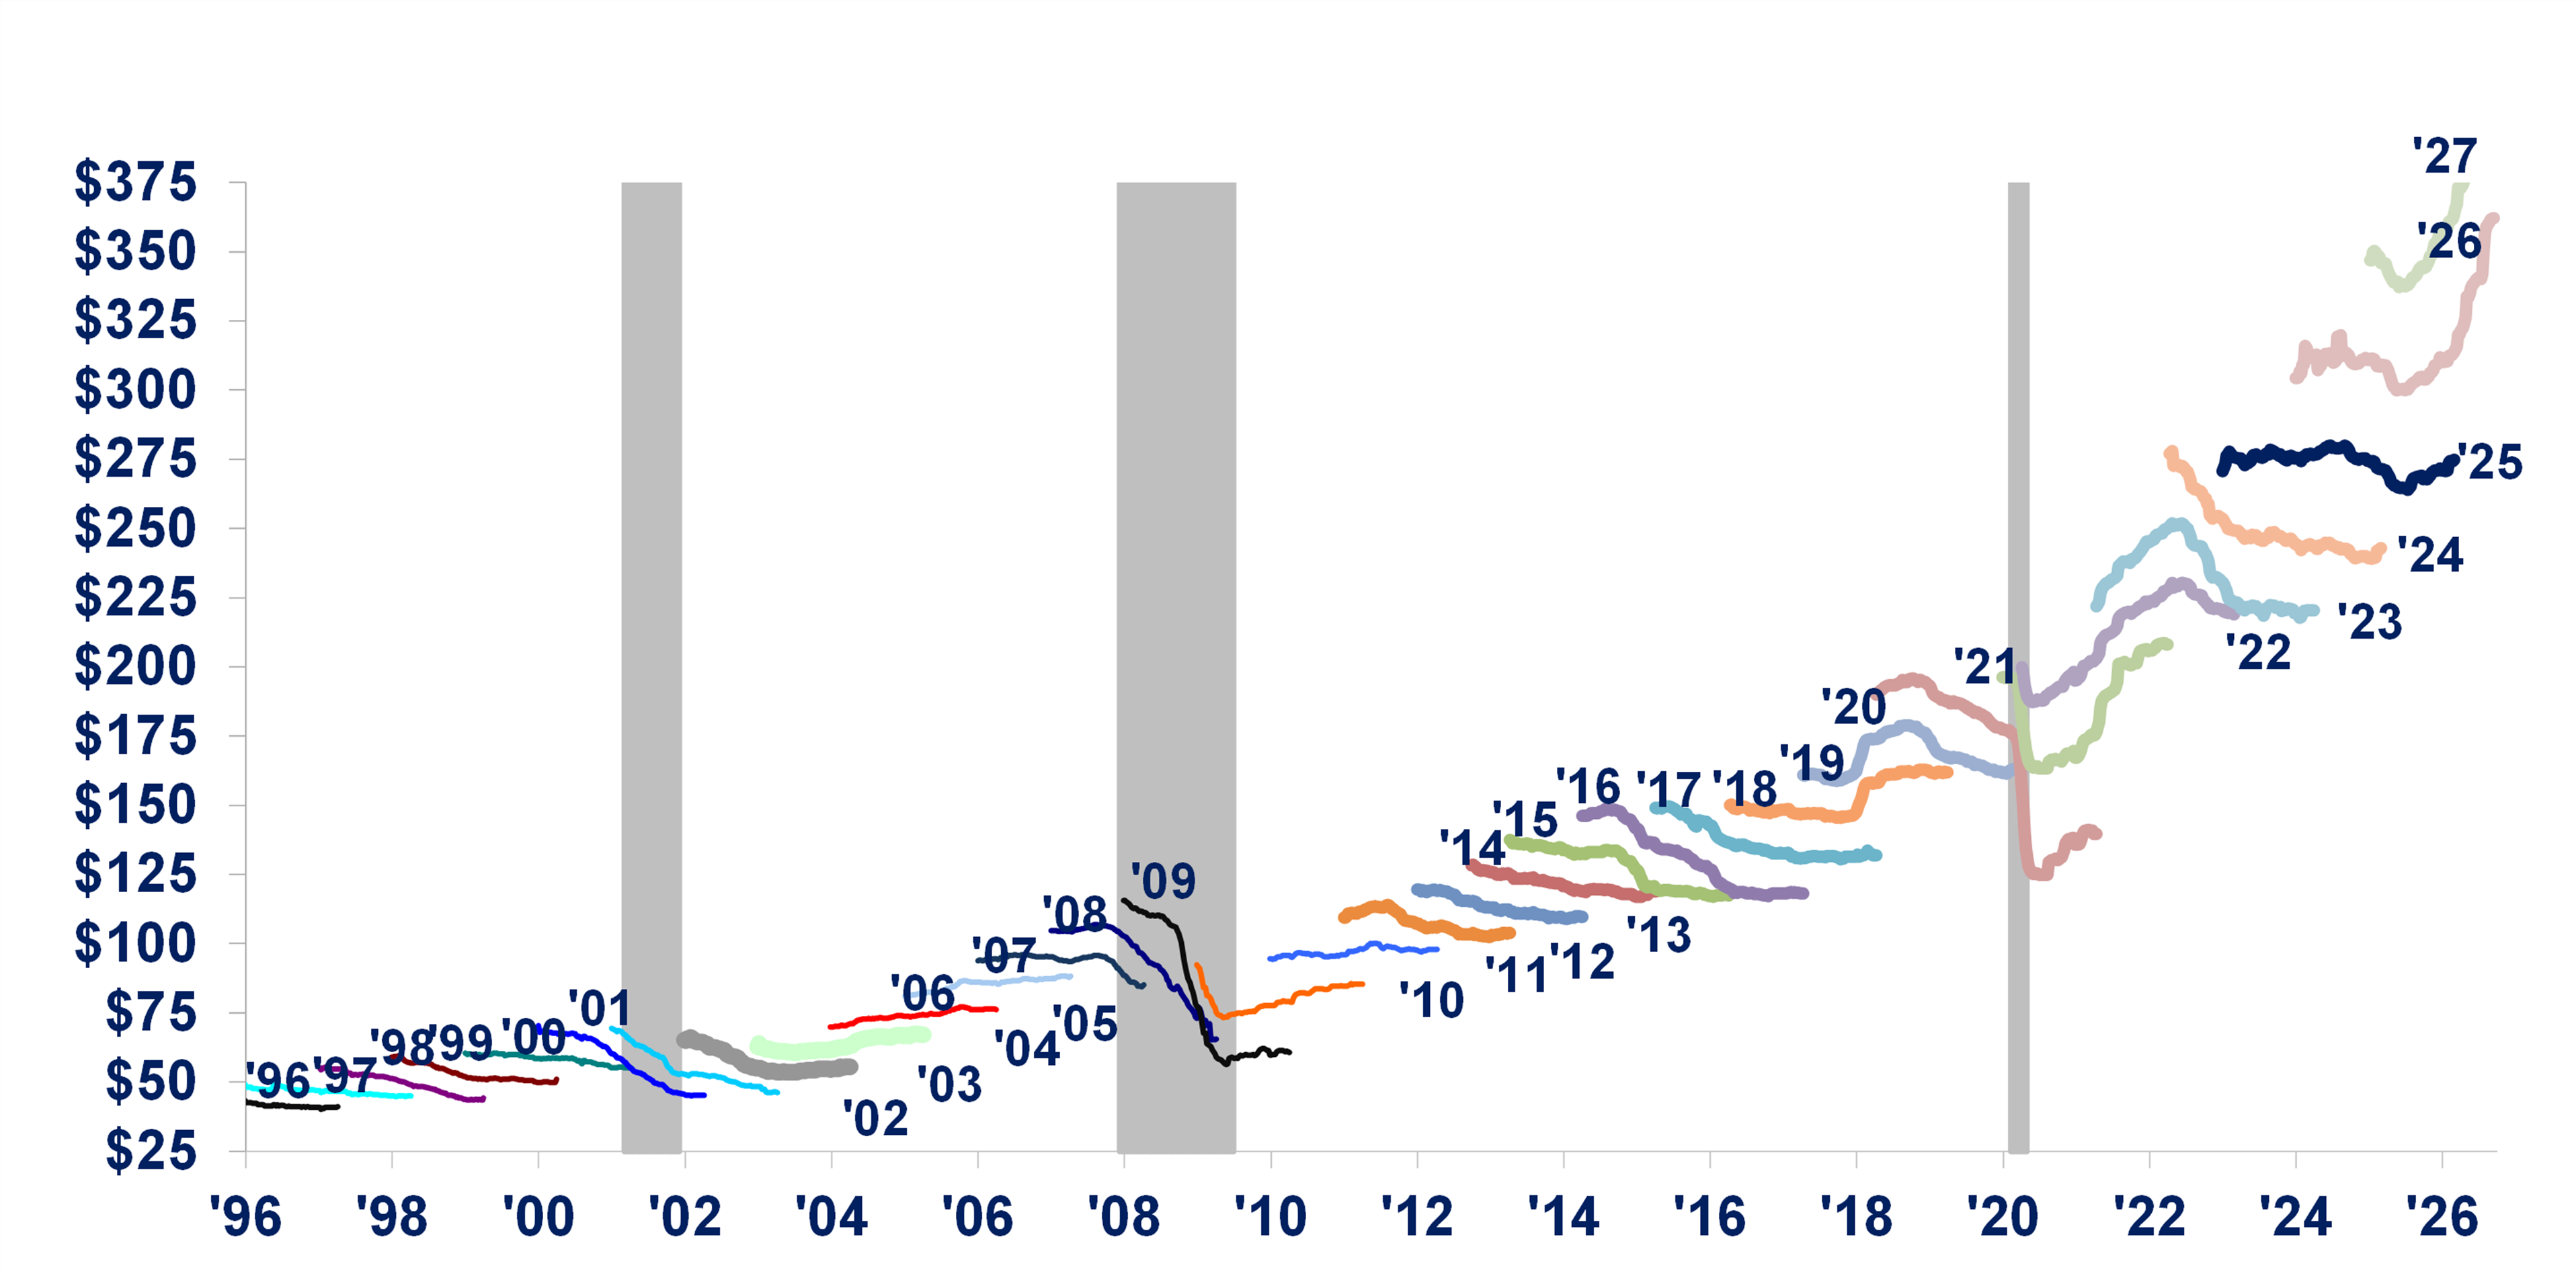
Another factor that we view as bullish is the upward revision in earnings-growth estimates for the S&P 500® Index. These estimates typically decline over the course of the year, but have actually increased for this year and next year as shown in Exhibit 6. We attribute much of this improvement to the positive impact of the AI buildout, including substantial capital spending, and the benefits of last year’s tax bill. In our view, the rise in earnings estimates is an encouraging sign.
| Exhibit 6: S&P 500® Index Annual Earnings Estimates (Consensus; Weekly) Key Takeaway: Wall Street consensus earnings estimates for a given year almost always start overly optimistic and drift downward as the actual year approaches, but the projections for 2026 and 2027 are bucking this historical trend. Source: Baird Strategas, FactSet, Data as of 10/8/2026 |
It often appears darkest before the dawn. In this case, the “dawn” could come after the midterm elections along with some resolution to the conflict in the Middle East. When that all happens (let us think positive) and if corporate profits advance as projected, even if they fall modestly short of current estimates, carefully selected companies with attractive valuations and strong earnings and cash-flow growth should reward investors.
If interest rates moderate with reduced inflation, real estate may become more attractive and bonds could recover some of their recent losses. In our opinion, the fact that so many companies are well below their all-time highs while earnings continue to grow point us toward the market being like a compressed spring, with price-to-earnings multiples having the potential to move higher.
Of course, we would be remiss not to mention that our national debt has now reached the horrible level of $40 trillion. We believe this issue will eventually need to be addressed through a pro-growth economic agenda and, possibly, tax increases.
We encourage you to stay the course with a balanced, customized asset allocation and consider prudent year-end planning, including using appreciated equity positions for charitable contributions. We will also take appropriate steps to harvest tax losses where possible.
As always, we remain available to help you rebalance asset allocations as needed and to work with your tax advisor in considering any actions that may be appropriate as we approach year-end.
We wish you and your families a wonderful and healthy upcoming holiday season. If the election outcome leads to potential policy changes with meaningful investment implications, we will share our perspective with you. Otherwise, we look forward to reporting to you in the not-too-distant future.
Best regards,
Robert D. Rosenthal
Chairman, Chief Executive Officer
and Chief Investment Officer