June 30, 2024
“The best way to measure your investing success is not by whether you’re beating the market but by whether you’ve put in place a financial plan and a behavioral discipline that are likely to get you where you want to go.”
– Benjamin Graham
The first six months of the year have resulted in reasonable gains for our clients who adopted FLI’s philosophy of investing in different asset classes and having a prudent, customized asset allocation. This diversification permitted our typical client to be exposed to what worked in the first half of the year, which was predominantly “growth shares.” Many of our clients also benefitted from exposure to the disruptive technology of artificial intelligence (AI). Specifically, once again, equity market appreciation has been biased to large-cap growth shares led by several companies (predominantly NVIDIA). At the same time, large-cap value-oriented companies, many paying dividends, were somewhat left in the dust. This is a pattern that began last year, which rewarded investors in the large-cap growth index as it trounced the large-cap value index.
The phenomena of a handful of super large Information Technology, Communication Services, and Consumer Discretionary companies driving markets forward resulted in a bifurcation between the S&P 500 Index (market cap weighted) versus the S&P 500 Equal Weighted Index.

In other words, if you were exposed to NVIDIA, Microsoft, Alphabet, Eli Lilly, Meta Platforms, Amazon.com, and several others, you enjoyed significant returns for the past six months. In particular, Microsoft, Apple, NVIDIA, and Alphabet are responsible for over 52%of the S&P 500 Index return through the first half of the year. If you were predominantly exposed to value-type companies, those primarily paying and growing dividends, which were not talking up the AI phenomenon, your returns were meager or modestly down in the second quarter. Our discipline at FLI is to try to expose our clients to both styles through our defensive and traditional equity baskets. Both baskets include strategies that expose our clients to both NVIDIA and other technology-oriented companies, while bookending that exposure with more traditional value-oriented companies, particularly those that grow
dividends on an annual basis and have fundamental balance sheet strength. We typically also include a modest exposure to fixed income, which for our clients was modestly higher over the first six months but provided a reasonable rate of interest and ballast to our overall investment plans.
This approach takes into consideration numerous current factors including:
- We do not anticipate a recession in the next twelve months. GDP growth should be in the 2% range.
- We expect inflation to continue to modestly and slowly abate.
- We believe that the Federal Reserve will keep interest rates higher for longer, but do expect one interest rate reduction later this year or possibly two.
- Geopolitical turmoil will continue and could possibly get worse.
- Domestic political uncertainty has just increased with the first Presidential debate and President Biden deciding not to run for re-election. We could be in uncharted political waters, and we are in an important election cycle with significant economic policy consequences.
- Earnings for the S&P 500 Index companies remain reasonably good, led by technology-oriented companies.
- Employment remains robust with the unemployment rate around 4%.
- Embedded inflation from the last three years remains a headwind for a portion of the U.S. population. This is impacting consumer behavior and affecting a number of consumer-oriented companies, at least in the short term.
Given this mixed bag of economic and political factors, sticking with a long-term asset allocation that attempts to navigate these uncertain waters continues to make sense to us. Growth shares are trading at somewhat high multiples as evidenced by the cap weighted S&P 500 Index (however nothing like growth companies in 2000). Value companies, which drag down the S&P 500 Equal Weighted Index, seem like bargains but do not possess the growth in earnings that leading technology-oriented companies continue to demonstrate. Dividends and annual dividend growth seem to be out of favor for now, but we expect these types of companies will contribute decent performance over the long term as they have in the past. Small-cap companies have gone basically nowhere, either growth oriented or more value oriented (year-to-date the Russell 2000 Index is up a meager 1.7%). This area does present an opportunity as expressed by one of our small-cap outside managers in a recent meeting.
In the commercial real estate arena, higher interest rates and distress in office buildings has led to dismal results as measured by the REIT index. The exception probably is in real estate related to data centers, which are being gobbled up by large technology-oriented companies. The residential real estate market has been impacted by high mortgage rates and higher home prices, resulting in a lack of supply. (In our opinion, many do not want to give up a low mortgage rate on an existing home to move and secure a loan at a much higher rate.) Affordability is becoming an issue for some new home buyers.
As of this writing, the uncertainty and lack of popularity of the two apparent candidates for President may present some volatility going forward. This, coupled with two raging wars, provides for further uncertainty. On the other hand, growing earnings and high employment while inflation slows down provides some optimism. The ultimate impact in terms of earnings growth from the expansion of AI usage also represents a growth opportunity for corporate earnings. As stated, however, the happiness thus far in equity markets has not broadened out and seems to favor, for the most part, the leading large technology-oriented companies. Not the best situation for all investors. When this will change typically depends on when we face a recession; potential tax law changes impacting economic growth favorably or unfavorably; and, of course, the actions of the Federal Reserve.
All of our strategies in the defensive and traditional equity baskets have appreciated thus far this year. As stated previously, those with greater exposure to large technology-oriented companies fared decisively better. Having said that, it appears valuations favor a tilt towards more value-oriented companies. The growth bias can continue given the unknown horizon for AI-oriented companies. Whereas the prospective multiple on earnings for the S&P 500 Index for 2025 feels somewhat high, it should be remembered that the makeup of the S&P has changed dramatically over the past 35 years. There are more growth-oriented, innovative, technology-oriented companies and much less smoke stack or industrial companies. These, asset light and technology heavy companies trade at a higher price-to-earnings ratio.
We have shaved some of the big technology-oriented companies over the quarter. Most notably NVIDIA, which is still a major holding in several of our strategies as it has appreciated 150% year-to-date. Our dividend-oriented strategy, which has modestly appreciated for the first two quarters, has seen dividend growth on average of 7.3% so far this year with 67% of the companies
thus far reporting dividend increases (the strategy was slightly negative for the second quarter). This average dividend increase is more than twice the Personal Consumption Expenditures (PCE) inflation rate.
The second half of the year and beyond represents some challenges, but markets typically climb a wall of worry. The election is in November, and its outcome could affect tax policy in the coming years. The two wars present potential volatility given the uncertainty of possible escalation. The direction of inflation during the balance of the year will be instrumental in the interest rate policy of the Federal Reserve. Should inflation not abate sufficiently to move the Fed to decrease short term rates, this could result in equity market disappointment. Also, at some point both investors and the government should consider our federal debt as it approaches $35 trillion and the interest burden crowds out worthy government investment. Fiscal sanity needs to prevail going forward to stem annual deficits and our total debt.
Where does all of this leave us as investors? As the opening quote states, we need a plan not predicated on “beating” the markets, but a sane path to growing our wealth in a compounding way. This can only be achieved, in our opinion, by avoiding substantial losses through smart diversification, and bookending the majority of our asset allocation among growth and value-oriented equity strategies. In addition, quality fixed income, private real estate, and some possible alternative strategies can also contribute to the prudent diversification we feel is needed to navigate uncertainty over the longer term. Of course, we customize asset allocations for each client depending on their personal circumstances and long-term goals.
Enjoy the summer and feel free to contact me or anyone on our investment and wealth management teams to assist you.
Best regards,
Robert D. Rosenthal
Chairman, Chief Executive Officer,
and Chief Investment Officer
PS: From a historical standpoint, when the S&P 500 Index is up 12% or more in the first six months of the year, there is further happiness in the last six months of the year 79% of the time over the past 70 years! History is only a guide.
DISCLAIMER
The views expressed herein are those of Robert D. Rosenthal or First Long Island Investors, LLC (“FLI”), are for informational purposes, and are based on facts, assumptions, and understandings as of July 25, 2024 (the “Publication Date”). This information is subject to change at any time based on market and other conditions. This communication is not an offer to sell any securities or a solicitation of an offer to purchase or sell any security and should not be construed as such. References to specific securities and issuers are for illustrative purposes only and are not intended to be, and should not be interpreted as, recommendations to purchase or sell such securities. Nothing herein should be construed as a recommendation to purchase any particular security. The companies and securities described herein may not be held in every (or any) FLI strategy at any given time. Investment returns will fluctuate over time, and past performance is not a guarantee of future results.
This communication may not be reproduced, distributed, or transmitted, in whole or in part, by any means, without written permission from FLI.
All performance data presented throughout this communication is net of fees, expenses, and incentive allocations through or as of June 30, 2024, as the case may be, unless otherwise noted. Past performance of FLI and its affiliates, including any strategies or funds mentioned herein, is not indicative of future results. Any forecasts included in this communication are based on the reasonable beliefs of Mr. Rosenthal or FLI as of the Publication Date and are not a guarantee of future performance. This communication may contain forward-looking statements, including observations about markets and industry and regulatory trends. Forward-looking statements may be identified by, among other things, the use of words such as “expects,” “anticipates,” “believes,” or “estimates,” or the negatives of these terms, and similar expressions. Forward-looking statements reflect the views of the author as of the Publication Date with respect to possible future events. Actual results may differ materially.
FLI believes the information contained herein to be reliable as of the Publication Date but does not warrant its accuracy or completeness. This communication is subject to modification, change, or supplement without prior notice to you. Some of the data presented in and relied upon in this document are based upon data and information provided by unaffiliated third-parties and is subject to change without notice.
NO ASSURANCE CAN BE MADE THAT PROFITS WILL BE ACHIEVED OR THAT SUBSTANTIAL LOSSES WILL NOT BE INCURRED.
Copyright © 2024 by First Long Island Investors, LLC. All rights reserved.
First Long Island Investors, LLC was honored to host Natalie Karp, Founding Partner of Karp Loshak Long Term Care Insurance Solutions Brokerage, Inc., at the Garden City Hotel on May 8th for our semi-annual FLI Thought Leadership Breakfast. Karp Loshak, founded in 2008, serves as an independent broker affiliated with the leading Long-Term Care (LTC) Insurance carriers. The firm is highly respected for their educational and consultative approach, which has been recognized as a resource by the Wall Street Journal and Newsday for their expertise on LTC insurance.
The conversation began with Natalie providing an overview of the current LTC landscape, emphasizing the escalating costs of care and the importance of proactively evaluating LTC insurance options. She positioned LTC insurance as a crucial financial planning tool designed to mitigate the exorbitant expenses associated with LTC and highlighted the diverse range of LTC insurance solutions available.
Natalie noted that LTC insurance is often overlooked because people are reluctant to confront the possibility of future care needs. However, ignoring this reality can lead to significant financial and emotional strain. She cited the high and rising cost of care and that the typical LTC need spans three years, which makes the need for LTC insurance more critical as life expectancies continue to increase. As a general guideline, Natalie mentioned that approximately 70% of individuals aged 70 years and older, and 80% of those reaching age 80, will require some level of LTC at some point.
FLI emphasizes the importance of considering LTC insurance for, quality of life, tax planning and estate preservation for suitable clients. LTC insurance provides tax-free benefits, helping preserve income and assets that would otherwise be depleted by care costs. Without LTC insurance, income reallocation or asset liquidation may trigger income taxes. Additionally, potential payroll tax implications loom, as nearly 30% of states have proposed imposing new mandatory payroll taxes on those who do not have private LTC coverage in order to fund the LTC burden on Medicaid. LTC premiums may be tax deductible for individuals, and corporations can benefit from tax advantages by paying premiums on behalf of employees.
The FLI Thought Leadership Breakfast series aims to provide our clients with access to industry thought leaders and experts who can provide valuable insights to help them make informed financial decisions. We were pleased to feature Natalie Karp as our guest speaker and remain committed to providing this level of expertise through future events. If you or your family have an interest in Long-Term Care Insurance, please do not hesitate to reach out to any of us here at FLI.

“Invest for the long haul. Don’t get too greedy and don’t get too scared.”
– Shelby M.C. Davis
The first quarter resulted in strong absolute returns for our defensive and traditional equity strategies. Most strategies have exceeded their respective benchmarks year-to-date. This follows a significant bounce back in 2023 in the wake of a very difficult 2022 for equity and fixed income markets. In fact, several of our strategies have exceeded the prior peak at year-end 2021, which reflected several years of large gains. So, when one invests for the long haul, as the above quote states, they should be rewarded when the emotions of greed or fear do not prevail. There is one exception, fixed income, which was about flat for the first quarter including interest, following 2023 where results were modestly higher, and 2022 when losses were incurred.
Early on, the first quarter continued to be led by a small number of large-cap growth companies, such that the Russell 1000 Growth Index outperformed the rival Russell 1000 Value Index. This can mostly be attributed to the disruption of artificial intelligence (AI) and its role in many growth companies. In addition, international investing, while positive, also underperformed its rival S&P 500 Index. We believe these positive results, led by growth companies, reflect reduced inflation, higher earnings, few prospects for recession, and a Fed that most recently indicated three interest rate cuts were being considered later in the year. Of note, in the past several weeks, we witnessed a broadening out of stocks achieving 52-week highs, many of which were outside the large-cap, technology-oriented companies. We are watching valuation very carefully, especially for the largest technology-oriented companies, where even the reference to AI has led to share price gains.
The following charts reinforce our view that there is some broadening out of the markets, inflation is trending down (although not yet at a level sought by the Fed), earnings growth estimates for the average large company (S&P 500 Index) continues to be positive for 2024, and employment (not pictured) continues to reflect a strong, although slowing, economy (not one headed for recession in 2024).
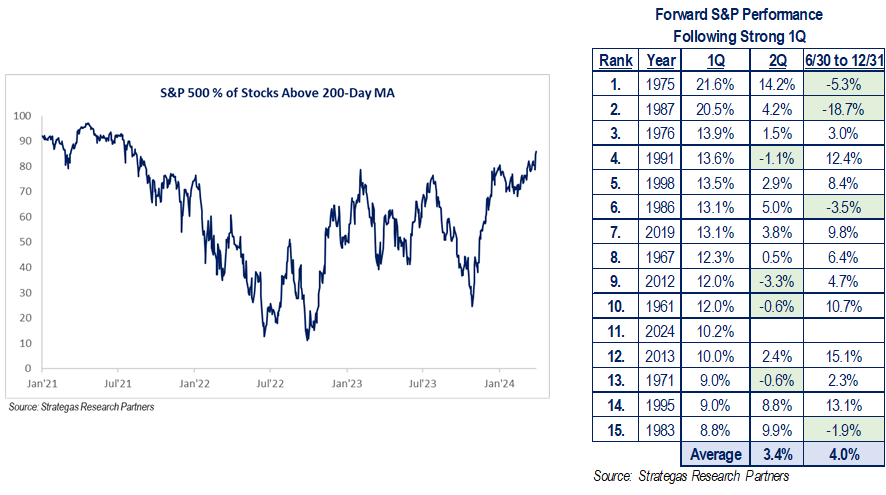
As the charts suggest from our consultant, Strategas Research Partners, the performance in the first quarter “rarely” suggests a market top.
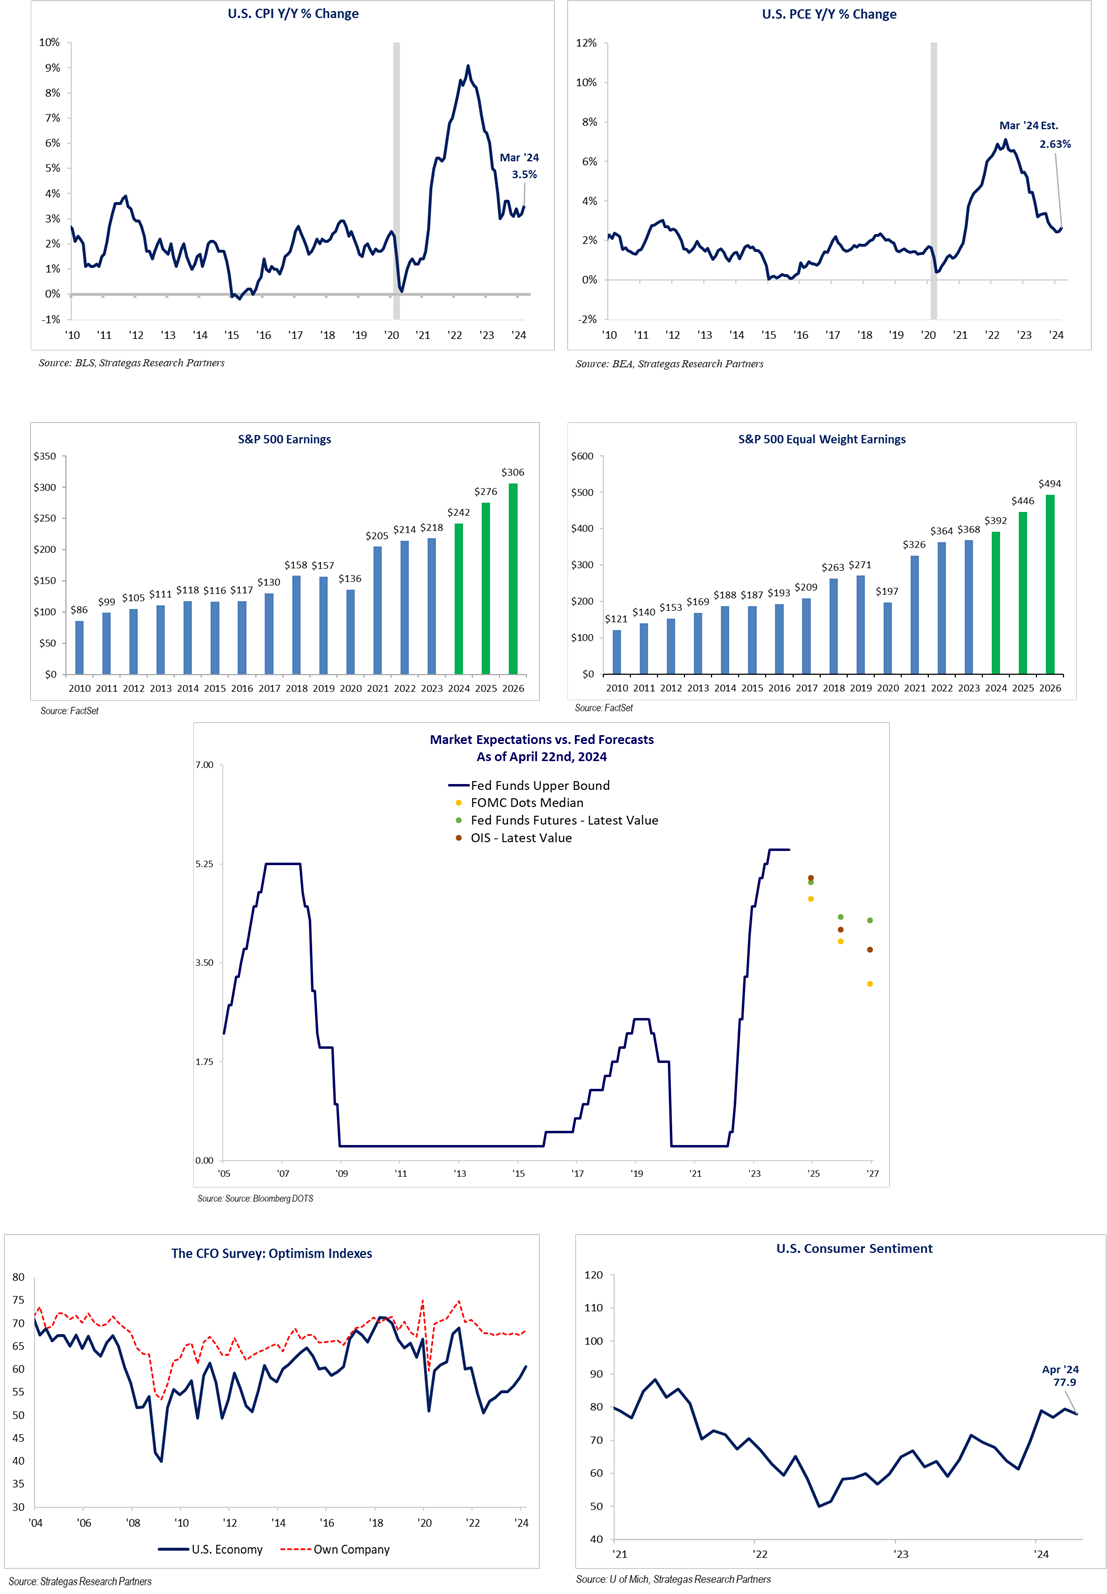
It appears, for now, that the economy can constructively deal with the yield on the 10-year U.S. Treasury being in a range of 3.75% to 4.75% and inflation that has dropped to 2.8% for the core PCE (the Fed’s preferred inflation measure) while unemployment remains below 4% and GDP growth is forecasted to be approximately 2%. These factors contribute to the projected growth in corporate earnings and our belief that we will continue to grow our clients’ wealth, with a prudent asset allocation, over the course of this year. Anecdotally, our contacts in the real estate industry have also indicated that financial conditions in real-estate financing have finally improved. A note of optimism.
So, what can go wrong?
With two wars raging and a presidential-election year unfolding, we cannot afford to be complacent. The Middle Eastern war between Israel and Hamas (a proxy for Iran) could result in an escalation of hostilities. Already, the Houthis (another Iranian proxy) are attacking ships in the Red Sea, causing some havoc with global trade. This could result in an upturn in inflation. Of course, a growing conflict in the region with another Iranian proxy, Hezbollah in Lebanon, is simmering. Also, there is no end in sight to the war between Russia and Ukraine. American policy is being challenged politically in the case of both wars as well as the potential cost to the American taxpayer. Fortunately, these events have not been disruptive to our financial markets thus far.
The heating up of our domestic political environment is another concern. Illegal immigration across our southern border has reached a crisis. The influx of immigrants to sanctuary cities and elsewhere is also causing an economic strain. Immigration, crime, proposed major tax increases by the current administration, and women’s reproductive rights are all major issues that will be debated as the year goes on. This, of course, is on top of the embedded inflation that Americans are faced with despite the rate of inflation abating. Additionally, the collapse of the Francis Scott Key bridge in Baltimore could have a minor inflationary impact.
Historically, equity markets have performed reasonably well in the fourth year of a presidential term. To help that result, incumbent administrations have at their disposal the power to spend. In this year’s case, the President has the CHIPS and Science Act, the Infrastructure Investment and Jobs Act, and the Inflation Reduction Act at his disposal to help the economy along. Again, we have said, both last year and this year in our thought pieces that we do not see the prospects of a recession occurring during this election year. This is a positive, to be weighed along with the uncertainty of two presumptive nominees who, according to the polls, a majority of Americans view as unfavorable.
Summary
We are off to a very good start, which historically has resulted in good results for the year, but there are many moving parts domestically and a significant level of geopolitical uncertainty. Some level of optimism is based on the Fed reducing rates at some point during the year. If inflation does not continue to abate and the Fed does an about face, that would not be good for equity, fixed income, or real-estate markets. The same could be said, in our opinion, as it relates to private equity.
We remain cautiously optimistic given the propensity of what we have described above. However, we remain true to our cautious nature while still working to grow our clients’ wealth through an individualized, prudent asset allocation. One that reflects a broadening of company participants in the equity markets’ rise, that includes owning both value and growth-oriented companies (which continue to play a major role in stock market advances), and that does not just rely on AI (which we believe is positive and
disruptive). Fixed income, on a pre-inflation, pre-tax basis, will continue to play some role in our asset allocations for clients, but a mix of defensive and traditional equity investments will be the major allocations for most clients.
Enjoy the spring season! Please call upon us for any and all of your wealth management needs. Stay tuned as we see what evolves with both the President’s attempt to increase income and estate taxes as well as the sunsetting of the Trump tax cuts over the next two years.
Best regards,
Robert D. Rosenthal
Chairman, Chief Executive Officer, and Chief Investment Officer
DISCLAIMERS
The views expressed herein are those of Robert D. Rosenthal or First Long Island Investors, LLC (“FLI”), are for informational purposes, and are based on facts, assumptions, and understandings as of April 25, 2024 (the “Publication Date”). This information is subject to change at any time based on market and other conditions. This communication is not an offer to sell any securities or a solicitation of an offer to purchase or sell any security and should not be construed as such. References to specific securities and issuers are for illustrative purposes only and are not intended to be, and should not be interpreted as, recommendations to purchase or sell such securities. Nothing herein should be construed as a recommendation to purchase any particular security. The companies and securities described herein may not be held in every (or any) FLI strategy at any given time. Investment returns will fluctuate over time, and past performance is not a guarantee of future results.
This communication may not be reproduced, distributed, or transmitted, in whole or in part, by any means, without written permission from FLI.
All performance data presented throughout this communication is net of fees, expenses, and incentive allocations through or as of March 31, 2024, as the case may be, unless otherwise noted. Past performance of FLI and its affiliates, including any strategies or funds mentioned herein, is not indicative of future results. Any forecasts included in this communication are based on the reasonable beliefs of Mr. Rosenthal or FLI as of the Publication Date and are not a guarantee of future performance. This communication may contain forward-looking statements, including observations about markets and industry and regulatory trends. Forward-looking statements may be identified by, among other things, the use of words such as “expects,” “anticipates,” “believes,” or “estimates,” or the negatives of these terms, and similar expressions. Forward-looking statements reflect the views of the author as of the Publication Date with respect to possible future events. Actual results may differ materially.
FLI believes the information contained herein to be reliable as of the Publication Date but does not warrant its accuracy or completeness. This communication is subject to modification, change, or supplement without prior notice to you. Some of the data presented in and relied upon in this document are based upon data and information provided by unaffiliated third-parties and is subject to change without notice.
NO ASSURANCE CAN BE MADE THAT PROFITS WILL BE ACHIEVED OR THAT SUBSTANTIAL LOSSES WILL NOT BE INCURRED.
Copyright © 2024 by First Long Island Investors, LLC. All rights reserved.

On March 25th Titan Investors held their inaugural New York event, the NYC Private Active Exchange. Some of the industries’ biggest investors in the area gathered to debate and discuss capital allocation approaches across public and private sectors, the investment environment and the economy. The event brought together leaders from Family Offices, Private Banks, Registered Investment Advisors and industry professionals including Chief Investment Officers, Heads of Research, Portfolio Managers and Senior Executives.
Philip Malakoff, Executive Managing Director and Director of Research at First Long Island Investors, LLC, accepted an invitation to participate in a panel discussion on public investment markets. The panel discussion, moderated by Steve Mula, featured prominent figures in the investment industry, including Philip Malakoff, Thomas Cahill, and Kevin Mahn. The panelists shared their expertise and insights on the current state of the investment markets, opportunities and challenges facing investors, and strategies for success in this dynamic landscape as well as how to address ultra-high net worth client concerns and some of their unique situations.
As a seasoned investment professional with over three decades of experience, Philip provided valuable perspectives drawn from his extensive knowledge of the markets and his work with clients. His insights have been molded by his role as Executive Managing Director and Director of Research at First Long Island Investors, LLC, where he leads the firm’s research efforts, contributes to investment decision-making and provides advice to the firm’s clients.
Philip’s participation in the panel discussion provided him with the opportunity to engage with industry leaders and share his unique viewpoints with a highly-targeted group of peers and highlights his status as a thought leader in the investment community and his commitment to educating and empowering the investment community.
First Long Island Investors, LLC is a leading private wealth management firm committed to providing innovative solutions and exceptional service to its clients. With a focus on research-driven strategies and a commitment to integrity, FLI has established itself as a trusted partner to high-net-worth individuals.
First Long Island Investors is thrilled to announce that Brian Gamble, Senior Vice President – Private Wealth Management, has been named a Dan’s Papers Business Power Player in the financial services industry. This prestigious recognition honors Long Island’s top financial services leaders who have consistently demonstrated a commitment to helping clients achieve their financial goals.
Throughout the year, Dan’s Papers will be spotlighting leaders across various industries who have made significant contributions to the Long Island community. As a Business Power Player, Brian Gamble joins an elite group of individuals who have dedicated their careers to providing exceptional financial guidance and fostering the long-term success of Long Island’s residents.
Brian’s dedication to clients and his expertise in private wealth management have earned him this well-deserved recognition. We congratulate Brian on this remarkable achievement.
Brian Gamble has over 17 years of experience in the financial services industry, and he is known for his personalized approach to wealth management. He is committed to helping clients make informed financial decisions that align with their long-term goals.